|
By Todd Litman
|
|
|
It is important for individuals and public officials to take all risks into account and avoid overreacting to transit terrorism risks in ways that increase overall danger. |
On 7 July 2005 terrorist bombs on London‘s transit system killed approximately fifty people and injured hundreds. This is not the first terrorist attack on public transit. In 1995 a religious group released sarin gas in Tokyos subway system, killing 12 and making thousands of people sick. In recent years bombs exploded on buses and trains in Israel, Madrid, Moscow, Paris and other cities.
|
|
|
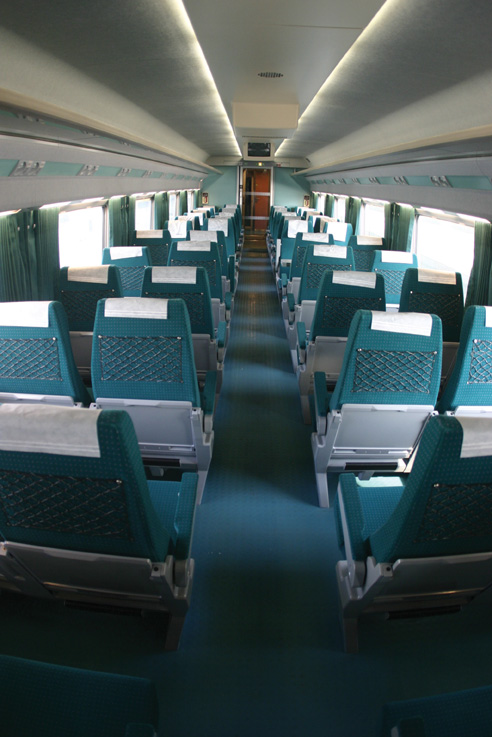
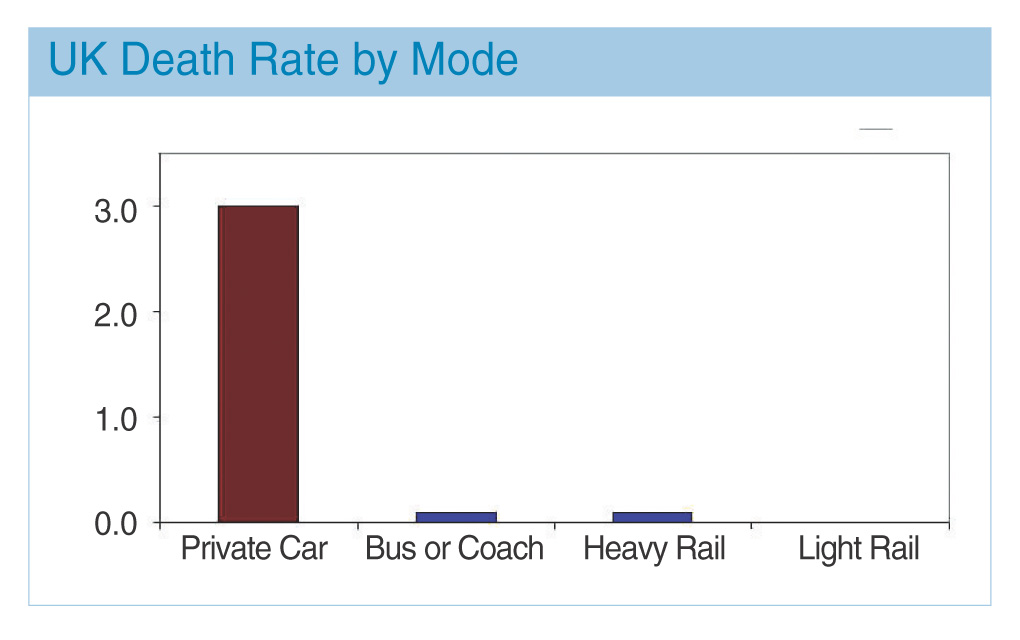
Figure 1. UK transit passengers have about 1/20th the traffic fatality rate per mile as automobile occupants. (Source: Steer Davies Gleave, 2005, Table 7.3)
|
Despite such events, public transit is still an extremely safe form of travel. The traffic fatality rate per passenger-kilometer is less than 1/10th that of automobile travel, as indicated in figures 1 to 3.1) Even including terrorist attacks and other crimes against transit passengers, transit is far safer than private vehicle travel.
|
|
|
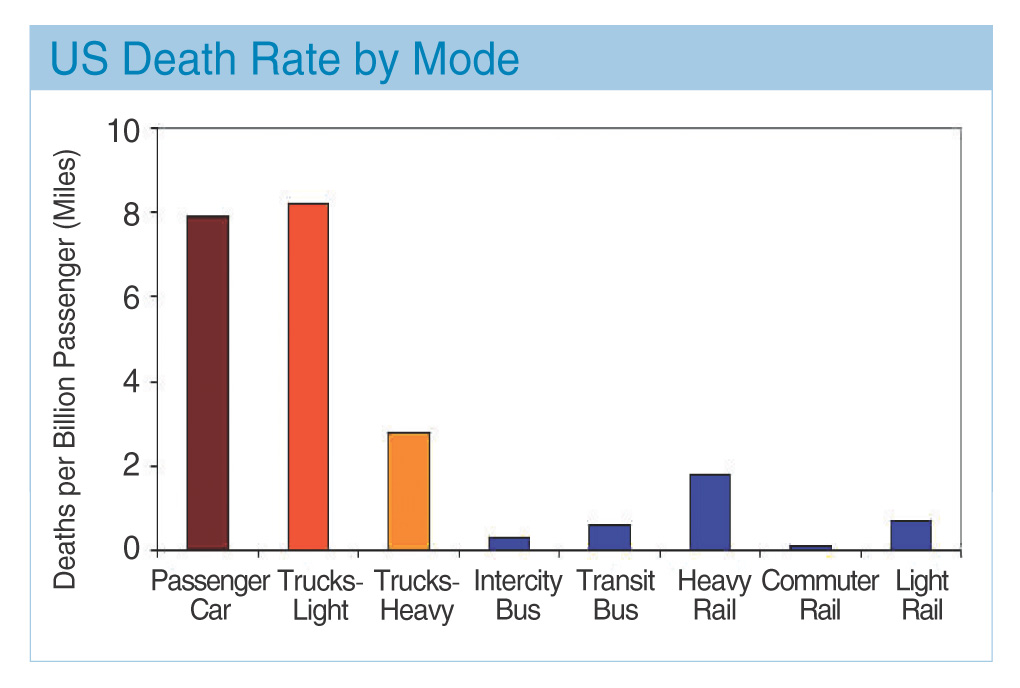
Figure 2. U.S. transit passengers have about 1/10th the traffic fatality rate per mile as automobile occupants. (Source: BTS, Tables 2-1 and 2-4; APTA, 2003)
|
|
|
|
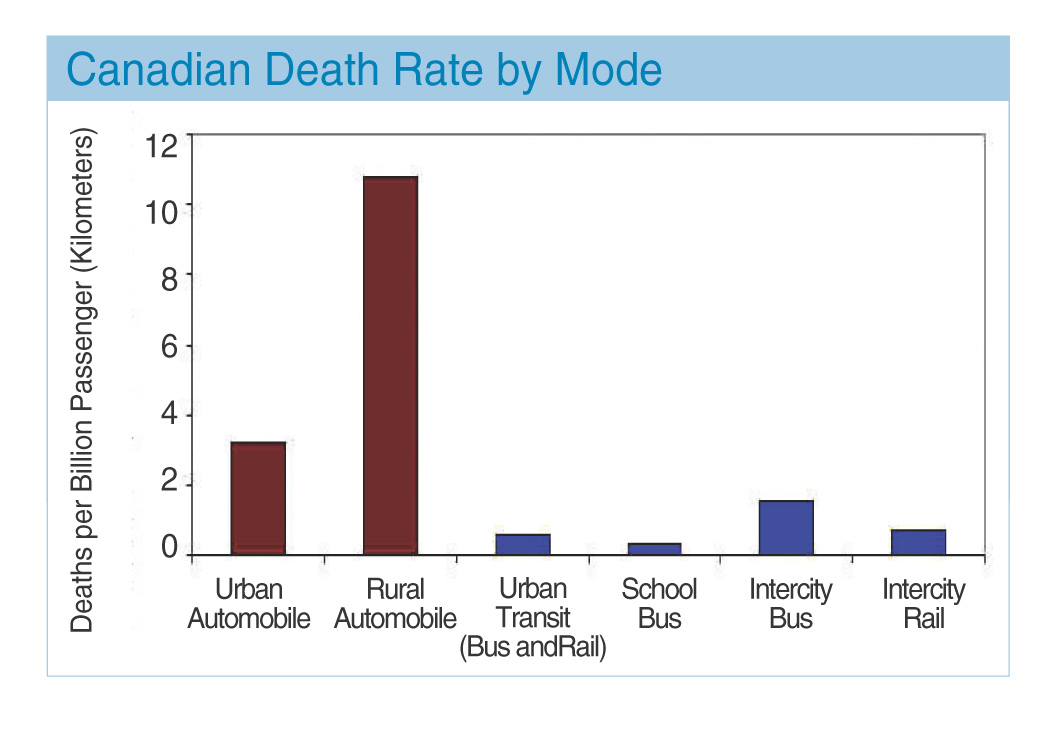
Figure 3. Canadian transit passengers have about 1/10th the traffic fatality rate as automobile occupants. (Source: CUTA, 2000)
|
Shifting travel from automobile to transit, and creating more transit-oriented communities, increases safety for transit passengers and other road users. Total per capita traffic fatality rates (including automobile, transit and pedestrian deaths), tend to decline as transit ridership increases in a community, as indicated in Figure 4.2)
|

|
|
Figure 4. Per capita traffic fatalities (including automobile occupants, transit occupants and pedestrians) tend to decline with increased transit ridership. (Source: FTA data)3)
|
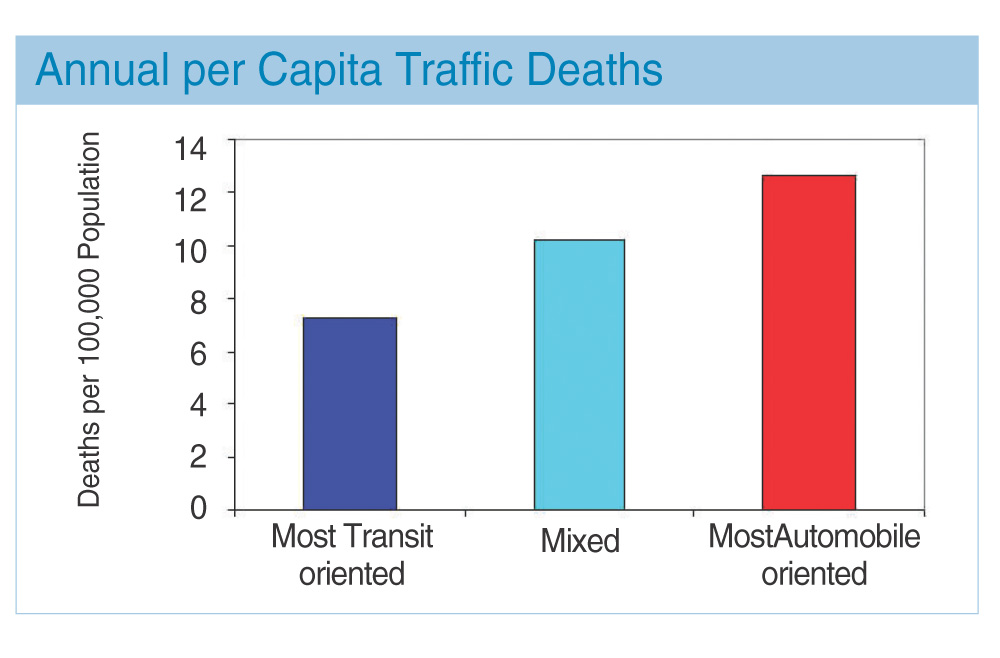
Residents of more transit-oriented urban regions experience far lower per capita traffic fatality rates than in automobile-oriented regions, as illustrated in Figure 5. Overall, transit passengers are much safer than motorists, and residents of transit-oriented communities are safer than residents of automobile-oriented communities, even taking into account risks from murder and terrorism (Lucy, 2002).
International data also indicate that per capita traffic fatalities decline with increased transit ridership, as indicated in Figure 6.
|
|
|
Figure 5. Transit-oriented urban regions have significantly lower per capita traffic fatality rates than more automobile-oriented cities. (Source: Litman, 2004)4)
|
|

|
|
Figure 6. International data indicate that traffic fatality rates decline with increased transit ridership. London has one of the lowest fatality rates of all cities listed. (Source: Kenworthy and Laube, 2000)
|
Annual road and rail traffic deaths total 286 in the London region, about 3,500 in the U.K. and more than 43,000 in the U.S., of which only a small portion involve public transit passengers, as summarized in Table 1.
.jpg)
Of the 286 transportation fatalities in London, only 5.6% involved public transport passengers, although public transport provides 24.2% of total passenger trips and 20.1% of passenger-kilometers, as indicated in Table 2.
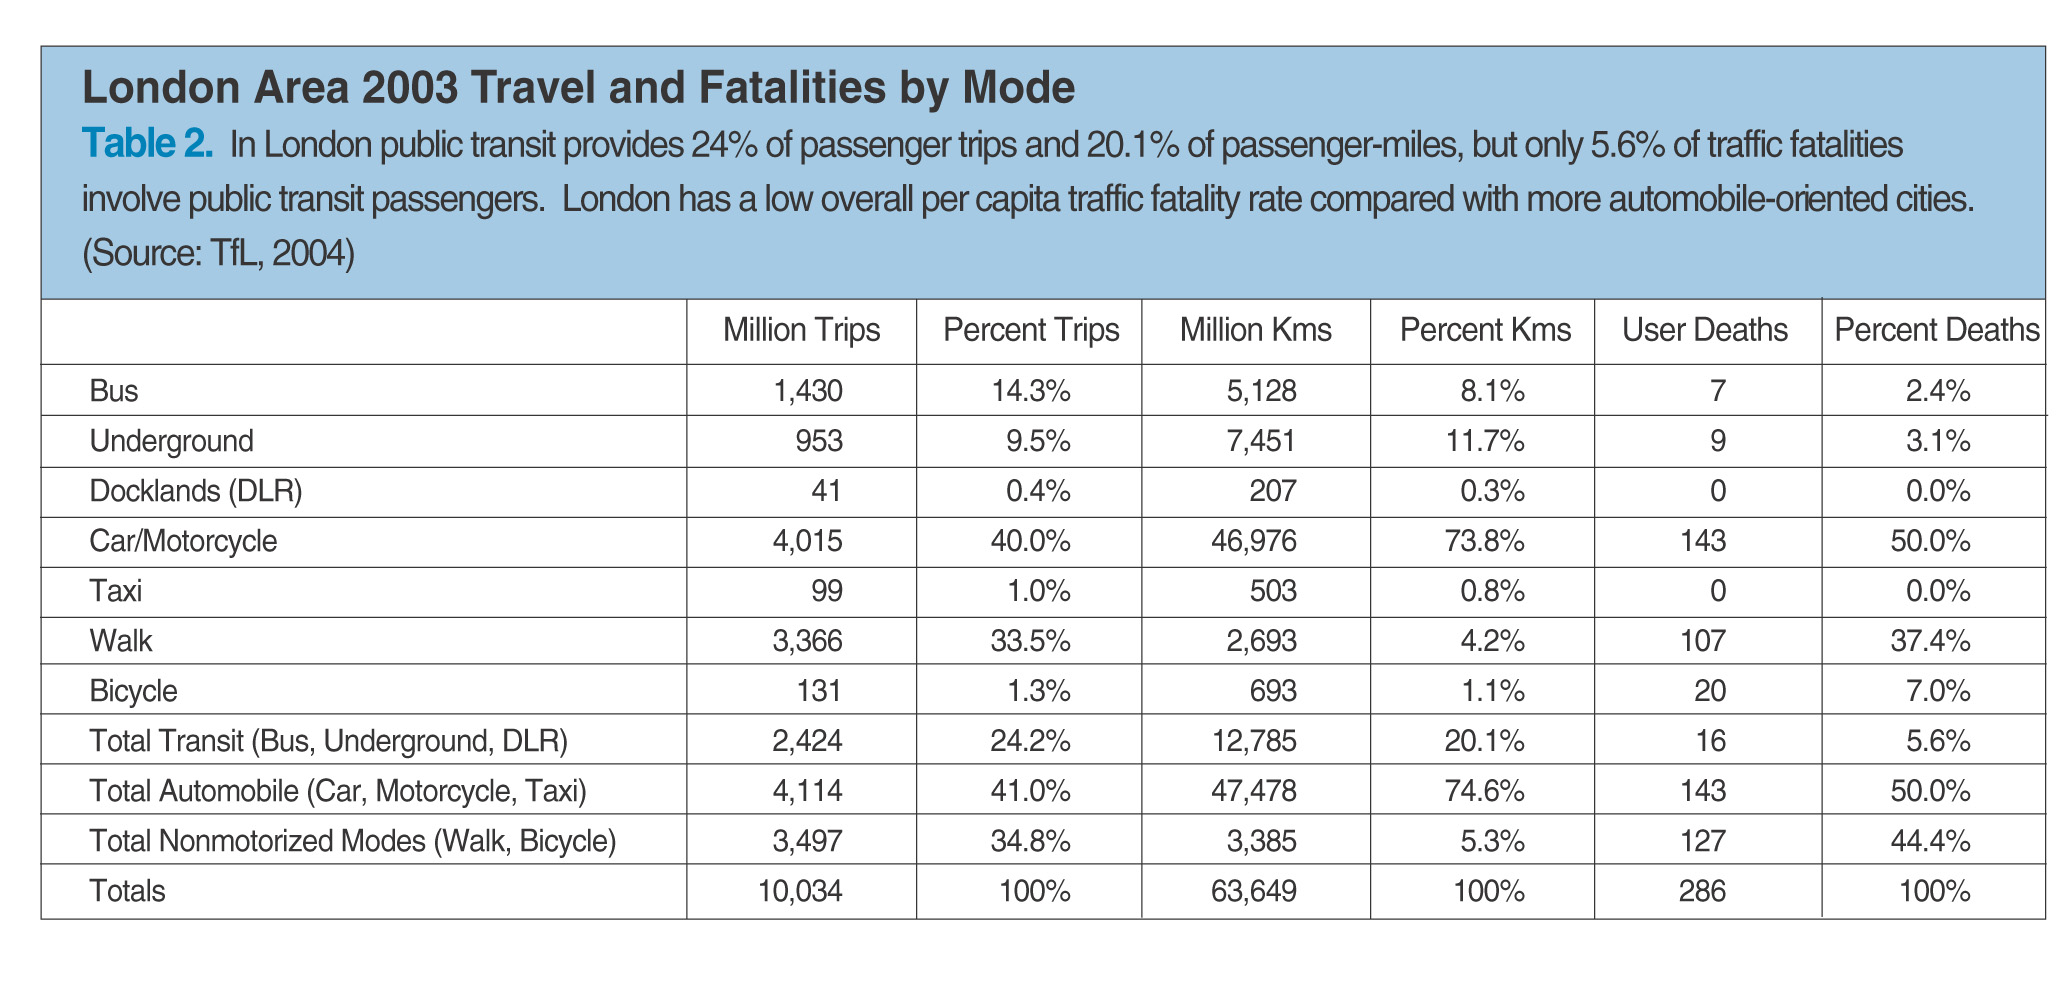
If public transit had the same average fatality rate per passenger-mile as automobile travel there would have been 104 additional deaths in London, 300 in the U.K., and 148 in the U.S. in 2003.5)
These are lower-bound estimates because they assume that each transit passenger-mile replaces just one automobile passenger-mile. However, when people shift from driving to public transit travel they often reduce their annual mileage, because transit users often choose closer destinations and avoid unnecessary trips. In addition, as public transit ridership increases in a community, per capita vehicle ownership tends to decline and land use patterns become more accessible and walkable, reducing vehicle travel.6) As a result, each transit passenger-mile often replaces several automobile vehicle-miles (Litman, 2004). This is one of the reasons that increased per capita transit ridership provides such large reduction in per capita traffic fatality rates, as indicated earlier. If residents of the "Transit Oriented" regions described earlier in Figure 5 had the same traffic fatality rate as the "Automobile-Oriented,?there would be about 2,500 additional traffic fatalities in the U.S.7)
These safety benefits of transit are much larger than deaths and injuries caused by recent terrorist attacks. In addition, public transit provides other health benefits, by reducing air pollution and increasing physical exercise, since most transit trips involve walking or cycling links (Litman, 2003). Although these health benefits are difficult to quantify, they appear to be comparable in magnitude to safety benefits, indicating far greater total health benefits from transit, and therefore much larger disbenefits when people shift from transit to driving. Travelers would increase their total risk if they shift from transit to driving in response to terrorist threats.
Transit risks tend to receive more attention than automobile risks. Because they are rare, incidents that kill or injure a few transit passengers often receive national or international media attention, while automobile crashes that kill a few people are so common they are considered local news, and injury accidents often receive no media coverage at all. 8)
There are several reasons that people react particularly strongly to transit terrorism. Transit terrorist attacks are designed to be highly visible, resulting in heavy media coverage. The fact that such attacks are intentional rather than accidental makes them particularly tragic and frustrating. And they raise fears that such attacks may become more frequent or severe, so risks may increase in the future. For these reasons, it is unsurprising that transit terrorism tends to instill more fear than other risks that statistically are likely to cause greater overall harm. That is exactly what terrorists intend.
This is not to suggest that transit terrorism risks are insignificant and should be ignored. On the contrary, transit terrorism is a serious threat which harms people both directly, through injury and property damage, and indirectly by creating fear and confusion. Strong action is justified to protect transit users safety and sense of security.
Society should work aggressively to prevent terrorists attacks, respond to incidents, and bring terrorists to justice. Transportation professionals, transit operators and users should be cautious and vigilant.9) Many transport organizations are currently working to increase transit security (APTA, 2005; FTA, 2005; MTI, 2005; Loukaitou-Sideris, 2005). Much more can be done. The federal government spent US$22 billion, more than US$9 per passenger, on air transportation security after than September 11, 2001 attacks, but less than 1 per passenger to increase railway and subway security (Howitt and Makler, 2005).
But it is important for individuals and public officials to take all risks into account and avoid overreacting to transit terrorism risks in ways that increase overall danger. Transit terrorism would cause greater total casualties and harm to society if individual travelers respond to exaggerated fears by shifting from public transit to less safe modes, or if decision makers respond by reducing support for public transit.
Such shifts have occurred. After the terrorist attacks on 11 September 2001, travel shifted from air to automobile travel. Analysis by Gigerenzer (2004) and Sivak and Flannagan (2004) indicates that in the three months after that terrorist attack there were several hundred additional roadway traffic fatalities than would have been expected based on past trends. Since air travel is much safer per mile of travel than driving, particularly on rural roads, much of these represent net increases in travel deaths. Had these trends continued for more than a year, the additional deaths would have exceeded the September 11 terrorist deaths. Because of effective action by governments and the airline industry, travelers have since been reassured about air travel safety, reducing these excess deaths.
After a high-profile transit accident or attack news reporters sometimes stick a microphone in front of transit riders and ask, "Now can you possibly continue using transit after what just happened?" with the implication that riding transit is dangerous and foolish. This reflects the myopic tendency of news media to consider just one issue at a time. But people and policy makers must balance many factors, including overall safety, efficiency and affordability. It would be foolish for travelers to reduce their transit travel in response to a terrorist attack, despite the fact that transit is an extremely safe mode of travel and provides other benefits to users and society.
When terrorist attacks occur, responsible leaders rightfully recommend that people return to their normal habits, including traveling by public transit. Cities repair their public transit systems and people use them, both for practical reasons and to show they are not intimidated by terrorism. As expressed by London Mayor Ken Livingstone in a statement to the terrorists written soon after the July 7 bombing,
"I know you fear that you [terrorists] may fail in your long-term objective to destroy our free society and I can show you why you will fail. In the days that follow look at our airports, look at our sea ports and look at our railway stations and, even after your cowardly attack, you will see that people from the rest of Britain, people from around the world will arrive in London to become Londoners and to fulfill their dreams and achieve their potential."
Todd Litman is founder and executive director of the Victoria Transport Policy Institute (www.vtpi.org).
|
References
|
|
-Much analysis in this paper is in the “Transit Risk” spreadsheet, available from the Victoria Transport Policy Institute website at www.vtpi.org/transitrisk.xls.
-APTA (various years), Public Transportation National Summaries and Trends Statistics, American Public Transit Association (www.apta.com/research/stats).
-APTA (2005), Public Transit and Security Issues Website (www.apta.com/services/security).
-BTS (various years), National Transportation Statistics, Bureau of Transportation Statistics (www.bts.gov).
-CUTA (2000), Transits Safety and Security Record, STRP S3, Canadian Urban Transit Association (www.cutaactu.ca).
-DfT (2004), Transport Statistics for Great Britain, Department for Transport (www.dft.gov.uk/stellent/groups/dft_transstats/documents/page/dft_transstats_031999.hcsp).
-FTA (2005), Transit Security Website, Federal Transit Administration (http://transit-safety.volpe.dot.gov/Security/Default.asp).
-Gigerenzer, G.(2004), "Dread Risk, September 11, and Fatal Traffic Accidents,” Psychological Science, Vol. 15, pp. 286 - 287.
-Howitt, Arnold and Jonathan Makler (2005), On the Ground: Protecting Americas Roads and Transit Against Terrorism, Brookings Institute (www.brookings.edu/metro/pubs/20050426_howitt.htm).
-Kenworthy, Jeffrey and Felix Laube (2000), Millennium Cities Database For Sustainable Transport, Institute for Sustainability and Technology Policy, distributed by the International Union of Public Transport (www.uitp.com).
-Loukaitou-Sideris, Anastasia (2005), Terror on Mass Transit, School of Public Policy and Social Research, UCLA (www.international.ucla.edu/article.asp?parentid=8849).
-Litman, Todd (2003), "Integrating Public Health Objectives in Transportation Decision-Making,"American Journal of Health Promotion, Vol. 18, No. 1, Sept./Oct. 2003, pp. 103-108, available at VTPI (www.vtpi.org).
-Litman, Todd (2004), Rail Transit In America, VTPI (www.vtpi.org).
-Litman, Todd (2005a), Evaluating Public Transit Benefits and Costs, VTPI (www.vtpi.org).
-Litman, Todd (2005b), Safe Travels: Evaluating Mobility Management Safety Impacts, Victoria Transport Policy Institute (www.vtpi.org).
-Lucy, William (2002), Danger in Exurbia: Outer Suburbs More Dangerous Than Cities, University of Virginia (www.virginia.edu).
-MTI (2005), Transit Security Publications, Mineta Transportation Institute (http://transweb.sjsu.edu/transitsecurity.htm).
-Sivak, Michael and Michael J. Flannagan (2004), “Consequences For Road Traffic Fatalities Of The Reduction In Flying Following September 11, 2001,” Transportation Research Part F: Traffic Psychology and Behaviour, Volume 7, Issues 4-5 (www.sciencedirect.com/science/article/B6VN8-4DS736P-5/2/3bfded271f0caf8e6bd07ad120603595), July-September 2004, Pages 301-305.
-Steer Davies Gleave (1005), What Light Rail Can Do For Cities: A Review of the Evidence, UK Passenger Transport Executive Committee (www.pteg.net).
-TfL (2004), London Travel Report 2004, Transport for London (www.tfl.gov.uk/tfl/reports_library_stats.shtml).
|
|
Endnotes
|
|
1) Figures 1 through 3 only show risks to transit passengers. Transit accidents also impose “external” risks on other road users (motorists, pedestrians and cyclists), but the marginal external risk of an additional transit passenger-kilometer is small, since most transit systems have excess capacity (only if additional ridership requires additional transit vehicles would external risk increase) and automobile travel imposes comparable external risks. For more discussion of marginal transit risk see Litman, 2005a and 2005b.
2) The decline in traffic fatalities associated with increased transit use probably results from a combination of reduced per capita annual vehicle mileage, lower average traffic speeds in higher-density areas, and reduced driving by higher-risk motorists, such as teenagers and habitual drunk drivers, due to better alternatives to automobile travel. Transit is a significant contributor to each of these factors.
3) The analysis for this graph is in the Transit Risk spreadsheet, available from the Victoria Transport Policy Institute website at www.vtpi.org/transitrisk.xls.
4) “Most Transit-oriented” are the ten U.S. cities with the highest per capita annual transit mileage (333 to 1,004 annual transit passenger miles). “Mixed” are the next twenty cities ranked by transit mileage (118 to 254 annual transit passenger miles). “Most Automobile-oriented” are the rest (15 to 114 annual transit passenger-miles).
5) Calculations in www.vtpi.org/transitrisk.xls.
6) Described differently, as a community becomes more automobile-oriented, destinations tend to disperse, due in part to the need to dedicate more land to roads and parking facilities, causing people to travel more in order to maintain a given level of accessibility.
7) Calculations in www.vtpi.org/transitrisk.xls.
8) For example, in 1995 the death of passengers in a Toronto subway crash was widely reported here in British Columbia. The same week the death of four teenagers in a car crash here was a local news story without media coverage in Toronto. This suggests that a transit passenger death receives about one hundred times as much media coverage as an automobile passenger death.
9) For more discussion of strategies for increasing transit security see the “Address Security Concerns” chapter of the VTPI Online TDM Encyclopedia at www.vtpi.org/tdm/tdm37.htm.
|
For more information, please send your e-mails to swm@infothe.com.
ⓒ2007 www.SecurityWorldMag.com. All rights reserved.
|